
1 Answers
 24
24i am giving the exlaiantion..plot it urself..its just shifting (nthing more than that)
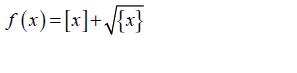
Domain:
{x}≥0 which is true..
so domain is all real nos..
-1≤x<0 => f(x)=-1+√x+1
0≤x<1 => f(x)=0+√x=√x
1≤x<2 => f(x)=1+√x-1
2≤x<3 => f(x)=2+√x-2
Proceeding this way try to plot it