 1
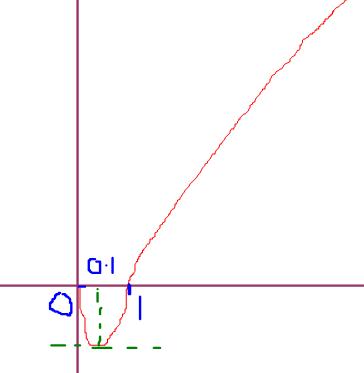
1The graph of x.logx will be like this.............

The graph of 3/√2 xlogx , will also be similar to the above graph, except that its values along y will become 3/√2 times their original values,
ie., the graph is stretched vertically..............
When U add the constant 3/4, the graph is shifted upwards by a magnitude, 3/4..............
So, the final graph will be like this.........

[339]
 24
24@Amritansh
to improve graphing ability ,i strongly adivce u to g othrough the graph of day ques here....no book contains that many graphs
 1
1@kalyan
ur graph of xlogx doesnt seem correct bcoz at x=0 y will be infinite
and when the constant is added y did the graph shift upwards and not sideways
 24
24calculate limit as x→0 dude(for f(x)=x.logx)... u will get 0
 1
1http://www.wolframalpha.com/input/?i=y+%3D+3%2F2^%281%2F2%29+x+log+x++%2B+%283%2F4%29
This is the graph of the above function for reference.
 24
24It has been repeated atleast 100 times here by everyone not to use graphing software to plot ur graphs.........Graph plotting is an art....dont insult it plz by using those software
 1
1how can u get it 0
log 0 is undefined
so at x=0 y becomes infinite
 1
1@amritansh
at x=0, logx=-∞, this is clear..............
but if U C, here V R talking about xlogx which is 0 as x→0
 23
23i think wat amritansh wants to say is dat the graph shud not touch the y axis
 1
1@Qwerty
Well, dude, thats right, the graph never touches the y axis............
the domain for logx is (0,∞), it is just the limiting value of the function that is 0............ The function is, of course, not defined at x=0
@Amritansh
Regarding #4
When graph of f(x) is known............
~ f(x)+k shifts up by k units
~ f(x+k) shifts to the left by k units

