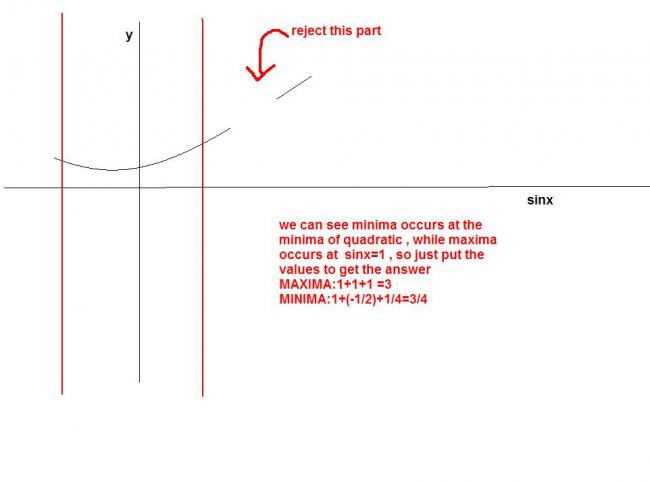
just draw graph of
1+x+x^2
wer ur x axis is sinx and restric values on x axis beween 1 to -1
lik dis
i m trying to learn to draw graphs , and i m facing a few problems with it.
we kno how to draw graph of a quadratic , and we can also draw graph of a few simple trigo functions
but when there is a situation such that the function is a quadratic of sinx , then shud be the approach ??
for eg: y=sin^{2}x+sinx+1
also if there is a quadratic of the form y=t^{2}+t+1
where t=x-\frac{1}{x}
wat shud be de approach ???
-
UP 0 DOWN 0 1 3

3 Answers
akari
·2010-01-26 07:05:32
eureka123
·2010-01-26 10:10:48
every time u plot graphs..just go from basic...use transformations to the least [1]
thats the key to success..