anyone?
1.Area of the region bounded by the curves x=y2-1 and x=|y|√1-y2 is
a.1 b.4/3 c.2/3 d.2
2.A man has 7 relatives 4 of them are ladies and 3 gentlemen ,his wife has also 7 relatives 4 of them are gentlemen and 3 of them are ladies.answer the following
A.in how many ways can they invite a dinner party of 3 ladies and 3 gentlemen.so that there are 3 of the man's relatives and 3 of the wife's relatives in the party.
B.in how many ways all the persons(including relatives ,man and woman)can sit on a round table so that no two women sit together
C.if all the men in the party sit in a row and women sit in a circle then SR-SC=k where SR:selecting 3 men such that no two are consecutive and SC:selecting 3 women such that no two are consecutive then k=____
-
UP 0 DOWN 0 0 5

5 Answers
q2.a
consider the table....
---------------------------------------------------------------------------------------
MAN || WIFE
--------------------------------------------------------------------------------------
G(3) | L(4) || G(4) | L(3) | WAYS
--------------------------------------------------------------------------------------
0 | 3 || 3 | 0 | 3C0 X 4C3 X 4C3 X 3C0 = 16
1 | 2 || 2 | 1 | 3C1 X 4C2 X 4C2 X 3C1 = 324
2 | 1 || 1 | 2 | 3C2 X 4C1 X 4C1 X 3C2 = 144
3 | 0 || 0 | 3 | 3C3 X 4C0 X 4C0 X 3C3 = 1
SO THE TOTAL NUMBER OF WAYS = 16+324+144+1 = 485

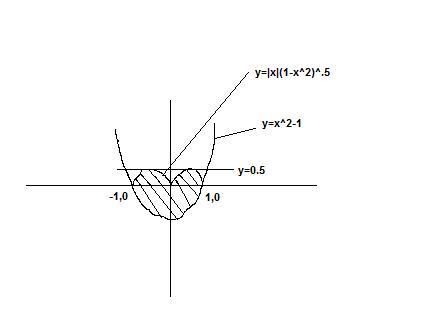
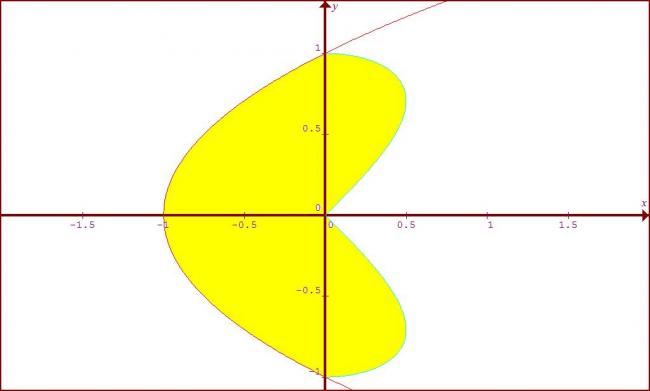
if we consider the area bounded by the x-axis then its coming 2....but including the lower prt of the parabola, it shud come more than 2
edited

so the area is
2\left| \int_{0}^{1}{(y^{2}-1)dy}\right| + 2\left| \int_{0}^{1}{(y\sqrt{1-y^{2}})dy}\right|
=2 23 + 2 13
43 + 23 = 2sq units ans...
thus answer is d...
for drawing the graphs...
consider...
x=|y|\sqrt{1-y^{2}}
x=y\sqrt{1-y^{2}} for y > 0 and
x=-y\sqrt{1-y^{2}} for y < 0
also at x = 0 , y = 0 ====> graph passes through origin...
and also at x = 0 y = ± 1
now consider ...
dxdy = \sqrt{1-y^{2}} + \frac{y.(-2y)}{2\sqrt{1-y^{2}}}
now consider
dxdy = 0
==>\sqrt{1-y^{2}} + \frac{y.(-2y)}{2\sqrt{1-y^{2}}} = 0
This gives... y = ± 1√2
now consider...
\frac{d^{2}x}{dy^{2}}\left|_{at y=1/\sqrt{2}} = -(...) < 0
====> x is max at y = 1√2
now consider..
\frac{d^{2}x}{dy^{2}}\left|_{at y=-1/\sqrt{2}} = (...) > 0
====>x is min at y = -1√2
now
for y = 1√2 (i.e y > 0)..
we have..
x=y\sqrt{1-y^{2}} = 1/2
and for y = --1√2 (i.e. y < 0)
we have
x=-y\sqrt{1-y^{2}} = 1/2
(since we have mod we are getting both maximas at y = 1√2 and y = --1√2)
Thus by plotting in graph with these data we get the required graph...
at first i had used graph calculator to get the graph..so i tried to draw the graph mysellf..so i posted the method here...