S L Loney my friend
A parabola is drawn touching the axis of x at the origin & having its vertex at a given distance k,from the axis. P.T the axis of the parabola of the parabola is a tangent to the parabola ---
x2=-8k(y-2k)
-
UP 0 DOWN 0 1 12

12 Answers
tell me if it is wrong(becoz did this ques last yr)..i am almost there.......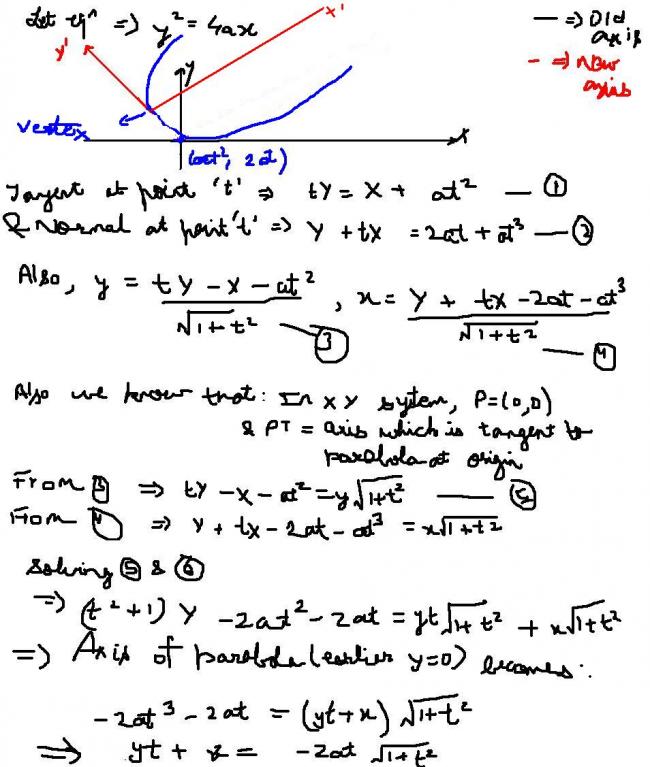
i guess this is arihant q ............i 2 tried last year i feel dat..wait lemme try again ;)
Actually I'm getting a kind of contradiction .....
If eqn of para is (x-b)2=4a(y-l), then b=0, as dydx=0 at (0,0)...
It obviously can't be the other way round...., that only gives k=0....
First of all note that any tangent to the parabola x2=-8k(y-2k) will be of the form
y = mx + 2k(1+m2) ------------- (1)
We shall prove that the axis of the second parabola is of this form.
First of all, note the following property of the parabola (an easy exercise to prove):
Draw a tangent at any point P to a parabola with vertex A. Let this tangent meet the axis of the parabola at T and let N be the foot of perpendicular from the vertex A on the axis. Then, AT=AN.
Consider the following diagram for the present case: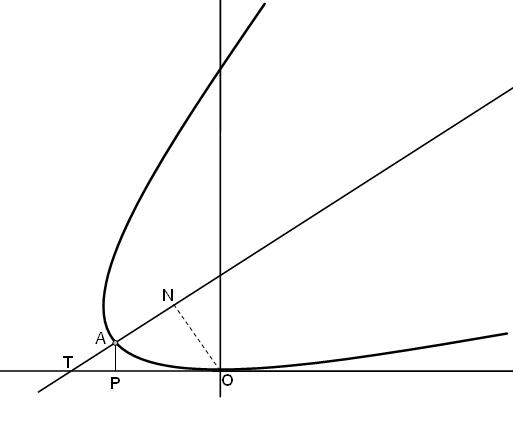
Let the axis be the line y = mx + c ----(2)
Then the equation of ON which is perpendicular to the axis, is of the form
y = -1m x -----(3)
The y coordinate of N is obtained by simultaneously solving (2) and (3):
y-cm = -my
i.e.
yN = c1+m2
But, since A is the mid point of NT, we get
k = c2(1+m2)
i.e c = 2k(1+m2)
Hence, from (2), we get that the equation of axis is of the form
y = mx + 2k(1+m2)
so it must be a tangent to the parabola x2=-8k(y-2k).
I dont know about kaymant sir..
but i use office 2007 for making images...
Well, as far as I am concerned, I use a variety of software to draw depending on the need.
For drawing diagrams, I generally use XFig. Its very easy to export to be included in LaTex files: For example: here is a snapshot of a hand in XFig:
The same hand processed in LaTex: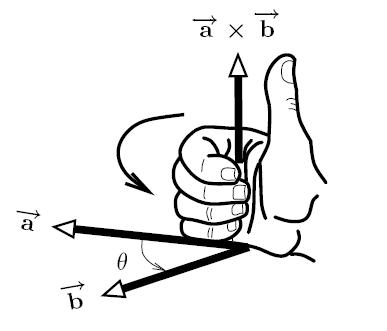
For more specialized purpose, like plotting a graph, I use Ghostscript which require some simple programming: here is a plot of sin(1/x) generated by gs: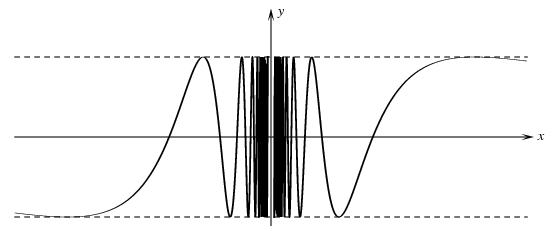
One more example using gs: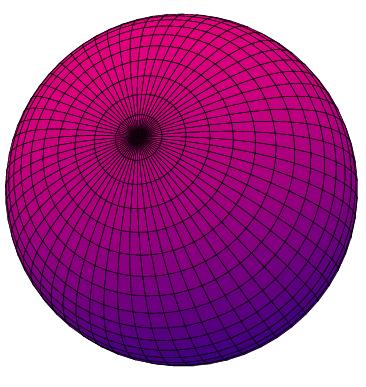
However, the parabola I posted for the problem over here, I used Word2003