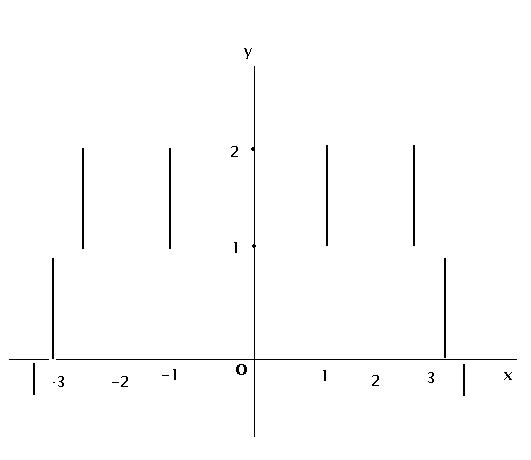
Is it this ???

EDITED ONCE
Yes jsgenius, graph will be like that only.
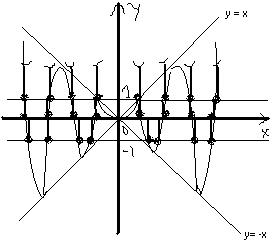
with values in negative quadrant also

- 1≤sinx≤ 1 → -x ≤ xsinx ≤ x
so curve will be bounded by y = x and y = -x
LHS i.e, [y] is integer so we need to find points for which RHS i.e, x sinx are integer
so drawing a line y = 1 , y = - 1 gives points where x sinx are integer and hence graph of candles follow...... those points
similaraly we can do for y = 2 , y = -2 , ......and so on
SRY if my garph looks too clumsy :P
edited now please confirm bhaiya
is my graph correct now ? [7]
jsgenius structure of your graph is correct.
But It is not clear, because ypu haven't mentioned anything.
Like what are that 1,2,3 on the x-axis
are that the value of x or the xsinx.
Its a little confusing actually.
Manmay your graph is almost correct. Just you missed one line of xsinx=1.
There will be two lines for xsinx=1 between x=0 to pi