pritish take one example of y = 1/x2
as x → 0 ,
y tends to infinity from both left and right .
But we cant define y at x = 0 .
So discontinuity is there.
y=(x3-1)/(x-1)
I am giving an easy one this time because to the tougher ones no one is getting a solution ;)
pritish take one example of y = 1/x2
as x → 0 ,
y tends to infinity from both left and right .
But we cant define y at x = 0 .
So discontinuity is there.
I've finally decided to ask....why is it not defined at x = 1? Can't we cancel out the (x - 1) term by factorization? If you really look at it as a function, why aren't we given a domain of values to operate on?
I just tried on different graphing calculators to make sure, and I was quite vexed...they're all giving the graph for x² + x + 1 for all values of x, even though in the Points Plot tab for x = 1, no value is displayed for y. There should be a vertical asymptote at x = 1 then isn't it?
pritish when u are cancelling (x-1) that means u r assuming that u wont take the value of x as 1 .
it is similar to 0 / 0 . Can i cancel the zeros and say 0/0 = 1 ?
and here LHL = RHL at x = 1 is 3 but not ∞ or -∞ .
so no asymptotes.
not a vertical asymptoe
there will be just a hole
that asymptote thing that u are talking doesnt come in the case 00 case
it comes in x0 case where x is definite quantitiy not equal to 0
ohhh achaaa.matalb their ll be discontinuty at tht point baki curve waisa hi hoga
@pritish
the definition of a limit
it is limit x (tends to 1 ) that exists
the function at x=1 is undefined
jyada achcha is not important.. both of you missed the vital point thta the function is not defined at 1!
Ok so in this case LHL = RHL ≠Value so there is a sort of point discontinuity at x = 1?
considering {.} denotes fractional part,
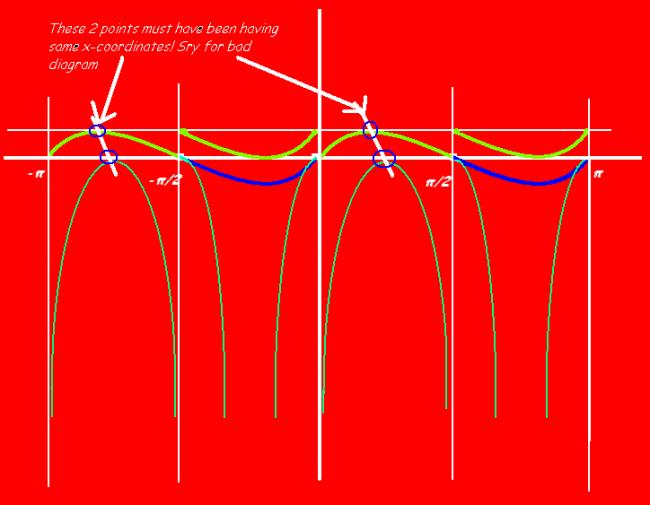
the graph will be something like this!!

the 5 vertical lines drawn have the eqns
x= -Ï€,
x=- π2,
x=0,
x=Ï€2 and
x=Ï€
The blue lines are the remnants of the sin 2x curve
the yellow-green lines signify {sin 2x} curve {.} means fractional part
the dark-green lines signify the required graph i.e. ln {sin 2x}
apologies: the points marked in blue must have respectively having same x coordinates i.e. lying vertically above/below one another
P.S. : i used only ms-paint to draw this graph and i am feeling proud after being able to draw something as neat as this in paint :P
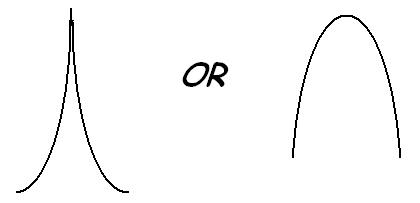
in the above two graphs the two inverted BELL-LIKE SHAPE are NOT parabolas
actually i am not absolutely sure abt the shapes
they can be either of

agree wid sanchit's question!!!someone reply..........
yes , what Sanchit is telling is true : the graph though parabolic , intersects the y axis at y=1 , OTHER GRAPHS GIVEN ABOVE ARE ACTUALLY WRONG !
can i ask one ques to nishant bhaiiya nd otherss.....dunno i ve ne roght to ask or wht....but still askin why r graphss not given these dayzzz.......
for u two i have a simple question...have u ALREADY solved ALL THE 100's of G-O-D given so far???
i don thnk so....!!!