 11
11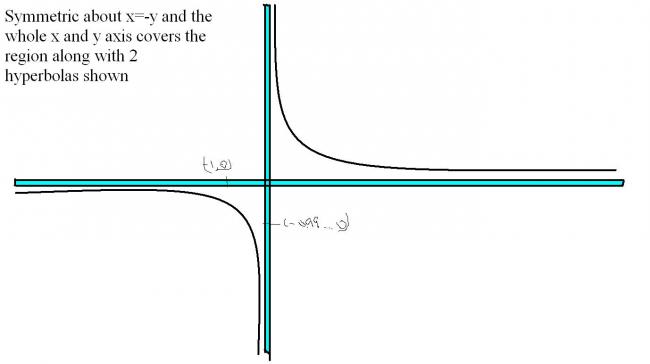
 3
3[xy]=0
xy=k (k belongs [1,2)
so for all values K we will get a set of rectangular hyperbolas

 106
106adding to akand.
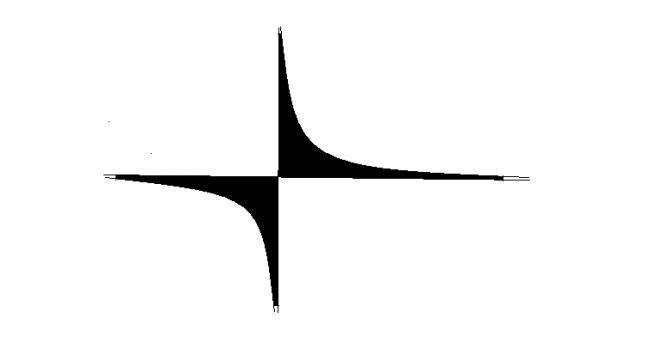
[xy] = 0
==> xy = [0,1)
==> graph is a set of rectangular hyperbolas such that xy=k where k varies from (0,1) and it is also the x-axis and y-axis for k=0
 62
62you guys are right
but manipal I have slight doubts about the graph that you have drawn :)
please see that one again!