 21
21sorry that was typo I meant to say discont. at x=0;
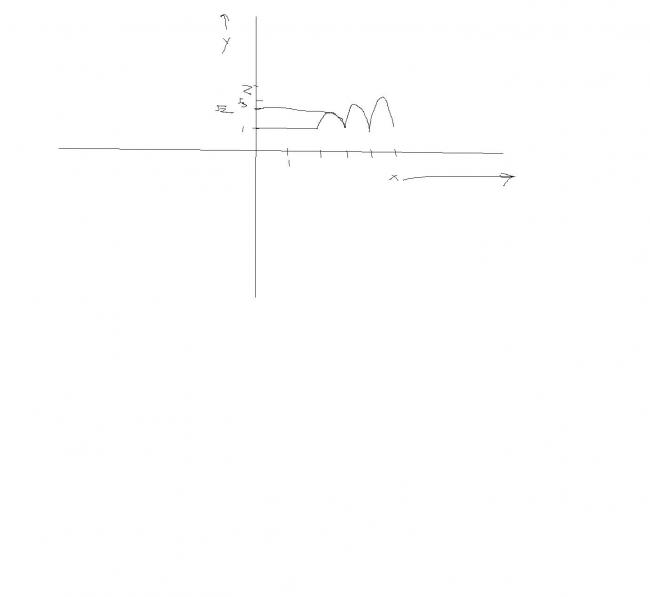
draw the graph of
y = [x]{x}
greatest integer of x to the power fractional part of x

 62
62the graph above is slightly misplaced.. otherwise it is fine overall..
 3
3shud be defined at x=1 ........1^0 =1 !!!
at x=0 ots noot defined i think 0^0 is not defined.....
nishant bhiyya is busy luks like hez not replyin to the queries i asked him[2]
3@ manipal ......... there will not be any local maximas between two integral values of x.....'i think ur graph is rong!!!!!![2]
21sriraghav.. ek galti shayad hai : 0^0 is indeterminate form.... so discontinuity at x=0....
wat say?
 11
11graph zarror banega for x<0 but with a lot of discontinuities
11i mean to say graph mein ek interval say (-1to-2) mein bahut zyada discontinuties aa jayengi
ie
(-2)-1/2,(-2)-1/4
and so on
the points will be imaginary and hence disconyinuity
62@manipal..
no dude. think again.. the previous graph is correct..
only thing i want is -ve x axis!
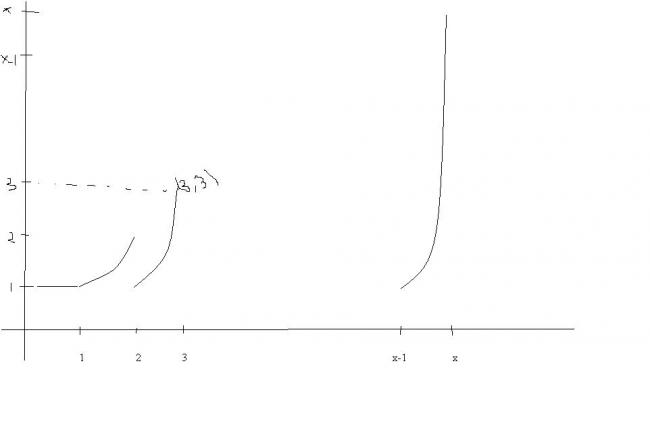
11the graph is bound to be continuous for x>0 but non differentiable
for x<0 the graph will be non continuous & non differentiable
62yes manipal your analysis is correct :)
but what is the actual graph?
1oh yes....... so first line will b 0
and second one will not b a curve but a st. line(value 1)
11arrey srighav ur graph is not right
put the value of x from 1-2
y will have its value 1 and not 1-2

 sorry 4 poor presentation sir,............