 3
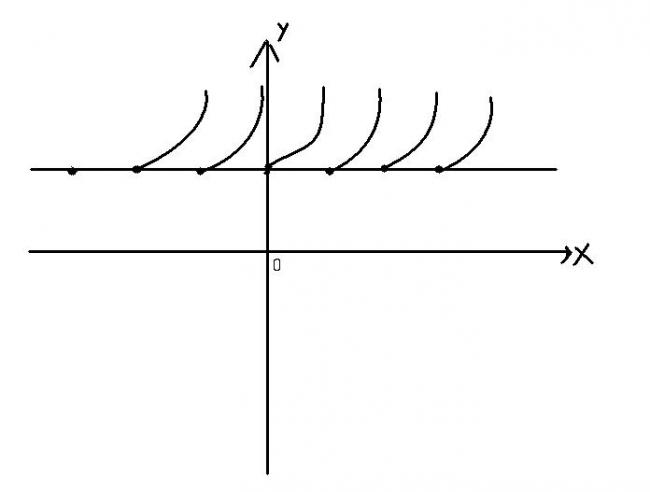
3y=ex-[x]-1
for [x]=1 y=e-2+ x
for [x]=2 y=ex-3
for [x]=-1 y=ex
for every integer values the graph has a change in x by x+1 or x-1
3y=ex-[x]-1
for [x]=1 y=e-2+ x
for [x]=2 y=ex-3
for [x]=-1 y=ex
for every integer values the graph has a change in x by x+1 or x-1

 62
62ashish can you tell what are the values at those points?
and will the slope of the curve be concave or convex?
 39
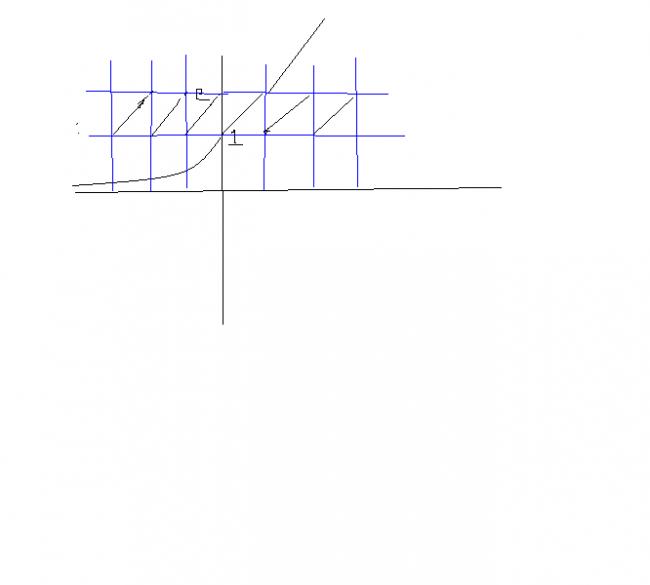
39this is the graph of y=e{x}.
the blue lines r not a part o the graph.
i dont know how to do y=e{x}-1
62@ b555...
You repeated the part above between 0 and 1
you needed to do repeat between parts -1 and 0
that wud be this graph :)
cheers :)