 33
33But function is zero where x=ln(-x) ... i.e for some negative x ≈-.567
33But function is zero where x=ln(-x) ... i.e for some negative x ≈-.567

 24
24Doing it without transformatons...first time...
lyl=lx+exl
y=x+ex
Dom=R
Range=R
y'=1+ex
But ex>0 always
So y'>0
=>y is increasing function for all xεR
y"=ex>0 always
So concave graph
X intercept => y=0 => ex=-x
We cant predict the accurate value so,we can predict its range of values
For x>0 ex≠-x becoz ex,x>0
So it will lie in (-∞,0)
for xε(-∞,-1) Range of values of y=x >1
So intersection must take place b/w xε(-1,0)
Y intercept => x=0 =>y=1
So graph y=x+ex will be..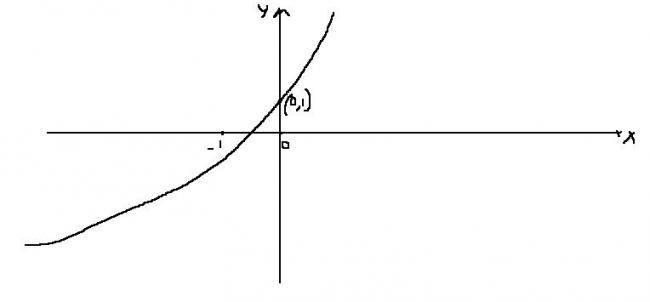
Now y=lx+exl
We know expression x+ex vanishes somewhere b/w xε(-1,0)
So for xε(-∞-1) y=-(x+ex)
xε(-1,+∞) y=x+ex
Analysing for this case, y=-(x+ex)
y'<0
y"<0
so convex decreasing
So graph of y=lx+exl will be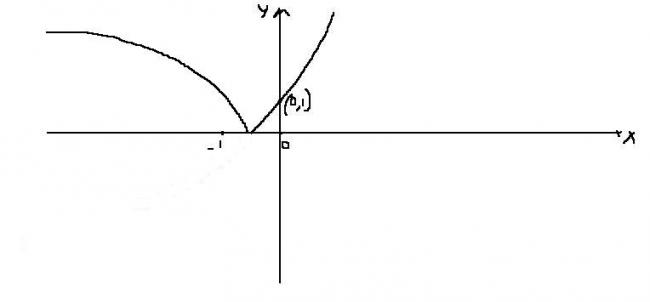
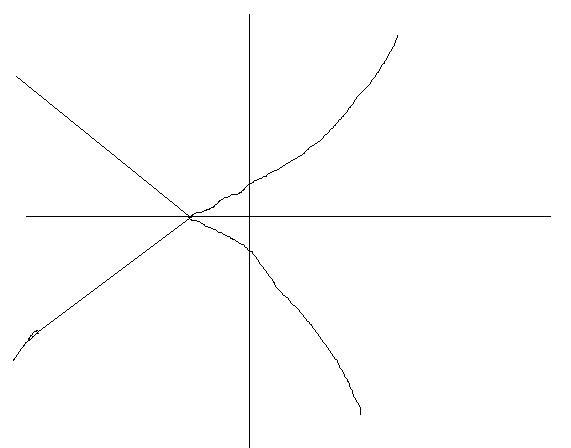
Now continuing for lyl=lx+exl
For y<0 -(y)=lx+exl
y>0 y=lx+exl
From this four cases arise,
y<0 xε(-∞-1) y=x+ex
y<0 xε(-1,+∞) y=-(x+ex)
y>0 xε(-∞-1) y=-(x+ex)
y>0 xε(-1,+∞) y=x+ex
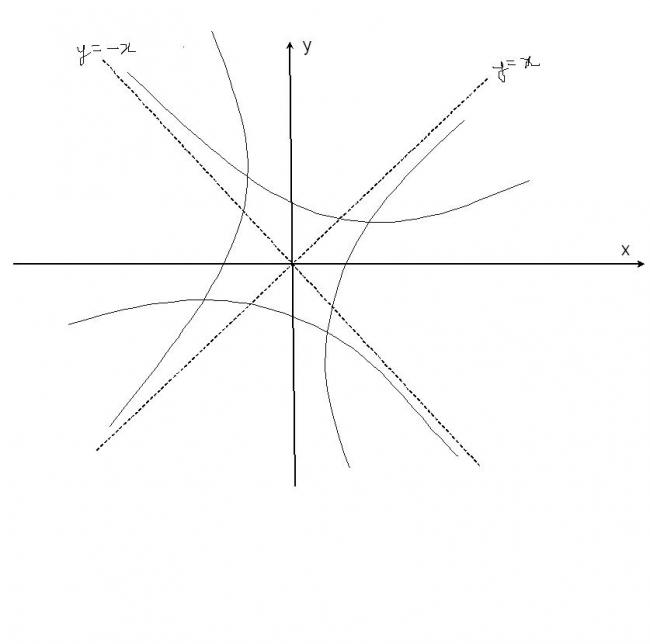
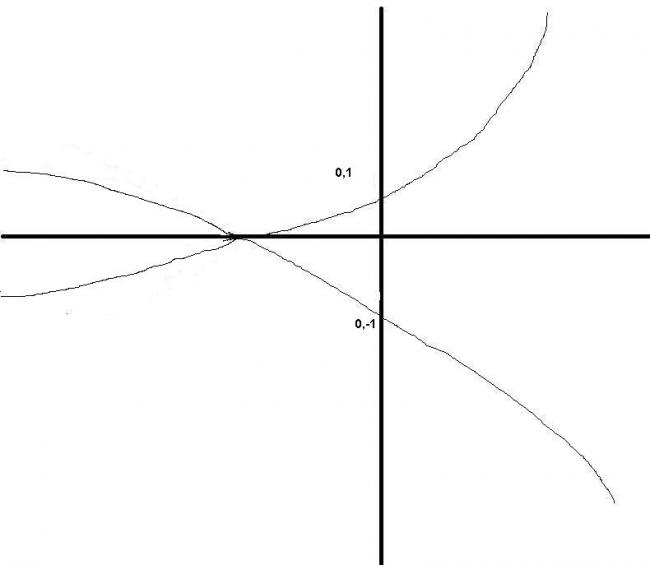
So the final graph will be..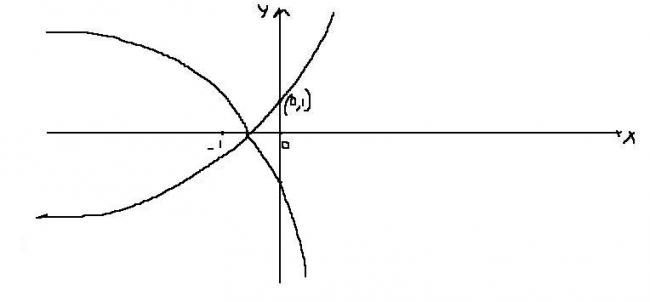
 21
21ashish there is a prob with the concavity of ur graph in 2 and 3rd quadrant i think
 106
106there are more issues... when x--> -∞ y-->∞ which you havent shown
106deepak: the points u have mentioned is wrong it shud be (0,±1) instead
33I only use it plot good quality graphs with good details..
never use in getting answer..
I had this software frm the begining but no one has ever seen this. in the forum as i never used it...
Its Microsoft Maths
33Non calculus method...
First y=|x+ex|
for x≥0
it is the sum of graph of y=x
and y=ex
here ex will dominate the nature of curve.... :)
so for y=|x+ex| for x≥0
it is almost similar to ex
with a slight difference
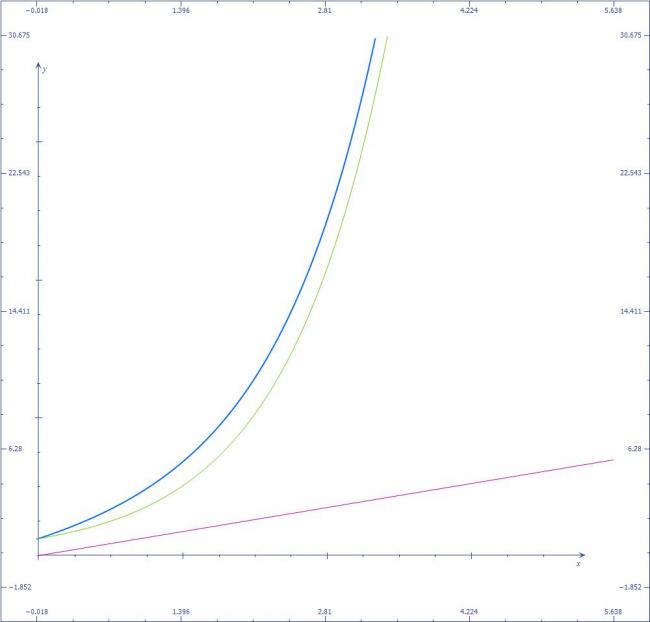
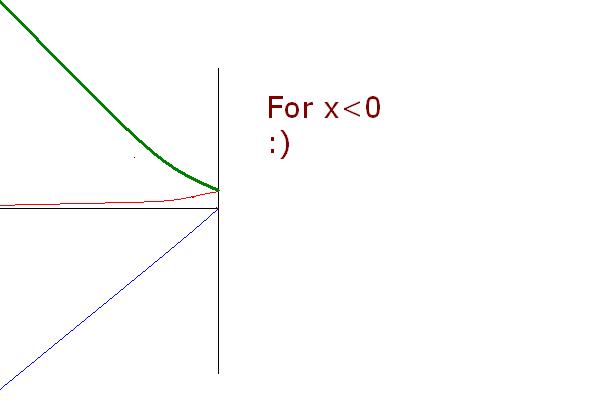
blue is ex+x
green is ex
and pink is x
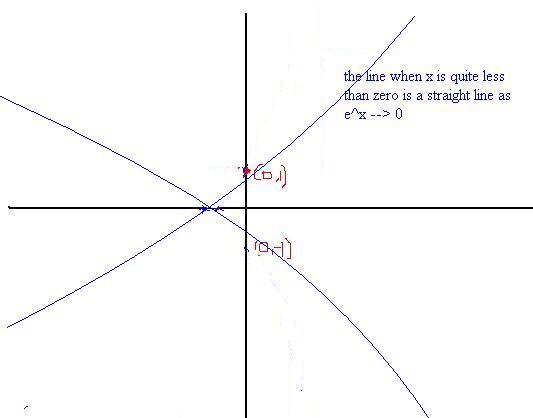
so for |y|=|ex+x| for x≥0 it is clear( mirror image about y=0...)
...contd..
33yup that one in negative that almost straight line will have slope nearly 1...
and positive part almost similar to ex
and a rough touch between where f(x)=0 and x=0..
i mean roughly mila do... dodno ko
:)
33Wait i am now posting a little nice picture with some more detalis :)


 [7]
[7]