n e one ???? plzzzz atleast give it a try...
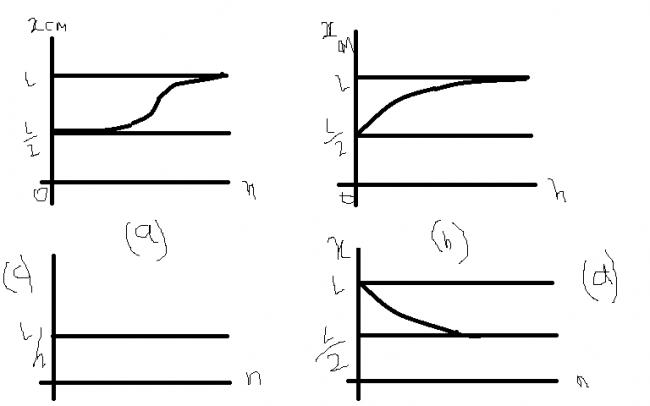
A thin rod of length L is lying along the x - axis with its ends at x=0 and x= L . Its linear density (mass/length) varies with x as k(x/l)n where n can be zero or any positive number. If the position xCM of the centre of mass of the rod is plotted against n, which of the foloowing graphs best approximate the dependence of xCM on n ?

Sorry for untidy graphs...these were the best I could make....any help would be appreciated..Thnxx in advance
-
UP 0 DOWN 0 0 3

3 Answers
Anirudh Kumar
·2010-02-10 05:50:00
\mu = k(\frac{x}{l})^{n}
mu= linear mass density
dm.x= \mu dx.x = \frac{k x^{n+1}.dx}{l^{n}}
x_{cm}=\frac{\int_{0}^{L}{dm.x}}{M}= \int_{0}^{L}\frac{k x^{n+1}.dx}{Ml^{n}}
x_{cm}= \frac{kL^{n+2}}{(n+1)Ml^{n}}
x_{cm}= \frac{kL^2}{M(n+1)}