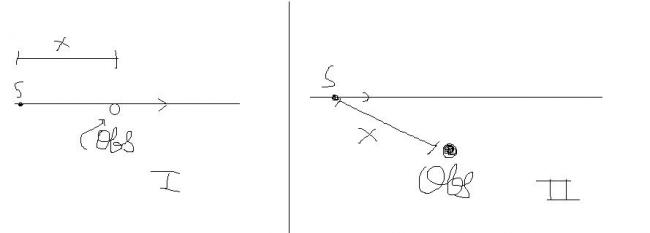
so when x=0 f should be...
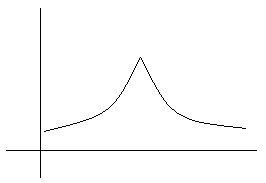
A vehicle approaches a stationary observer from a distance. Which of the following graphs describes the frequency heard by a stationary observer?
-
UP 0 DOWN 0 0 29

29 Answers
thats it !!
c and d are totaly absurd !
b is linear !
so ! ...have to adjust with a [6]
as the vehicle approaches a stationary observer from a distance the frequency increases with time...but not linearly
f is then inversly proportional to the time !!
and........guys no one thinks its (b) ???
no v is not constant wid time
u have to take the component of the velocity along the source and the observer da
n' = n0(c)/(c-v)
n' = n0(c)/(c+v)
hmmmm ya so a is corr as v is const wid time
sry guys again!!
x axis is time even i got confused and looked it up again

which case..1 or 2 .. it should be 2 as in 1 no change in freq...
but if its case 2 how can be x=0... but it is in graph..
or it x is distance...from foot of perpendicular from O to line of motion..
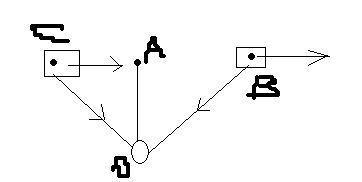
n'= n(c/c-v) for the points between A and C
which is gr8er than n
At the pt A no doppler effect there fore n'=n
After pt A
n'=n(C/C+v)
which is lesser than n
and so the graph will not c and d
the graph will not be linear can be proved by finding the component of velocity along the object
guys this is multiple choice question if the options were correct and so it shud satisfy the condns given by me.
only graph A satisfies my condns
i feel dats c coz as d observer is satinary n d vehicle is approaching it
n'=n(v/(v-s))
so frequncy of sound ehard by observre shud increase :S
let O be the observer At the pt A the doppler effect is zero and at the point B the observed frequency shud be lower than the original frequency and also the variation of the frequency is not linear.under these condition graph A only satisfies

