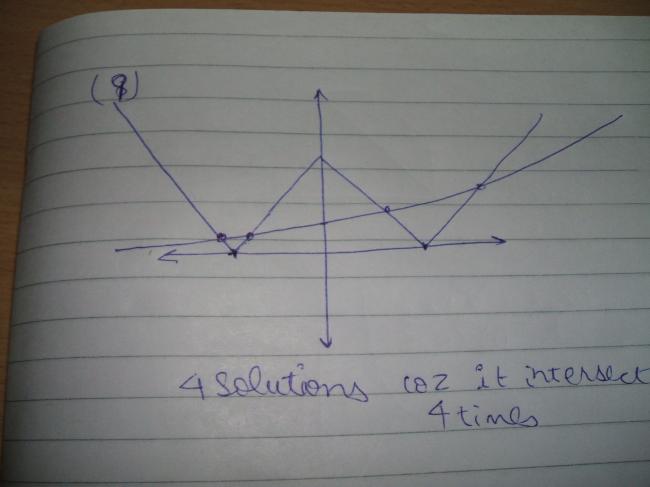
ISKO BANAO IN ALL THE POSSIBLE QUADRANTS
DON'T DRAW IN ONLY 1 QUADRANT
DRAW EVERYWHERE IT IS POSSIBLE!!!!!!!!!!!!!!
y=2{x}
simple but a good 1
-
UP 0 DOWN 0 0 42

42 Answers
Answer to #31
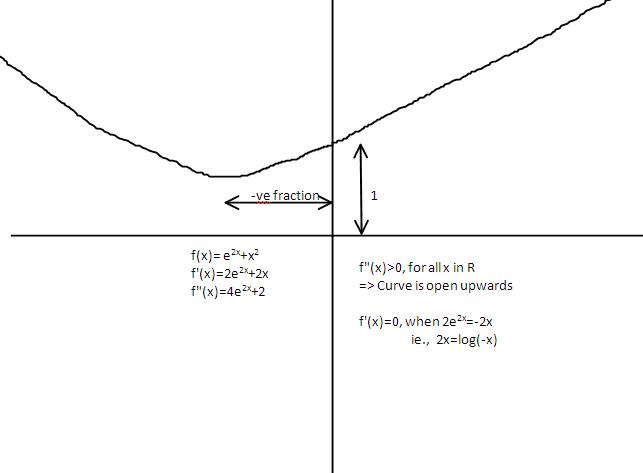
f"(x)=0, when 2x=log(-x)
Since log is gefined only for +ve values -x must be +ve, so x must be -ve.
When x is -ve, LHS is -ve. Log of a number is -ve only when the number is a fraction, so x is a fraction.
Therefore f(x) has the least value at a certain -ve fractional value of x.
Clearly function goes to -∞ on the -ve side (limiting x to -∞)
And to ∞ on +ve side (limiting x to ∞)
So the graph of f(x) will be as depicted
[339]
please check this one and correct me if wrong
my first try to add 2 functions

DO ANYBODY WANNA TRY THESE QUESTIONS
OR I MAY COMPLETE THE REST?????????
1 more graph
easy but conceptual
draw
f(x)=e-1/x2 x ε R - {0}
f(x)=0 when x=0
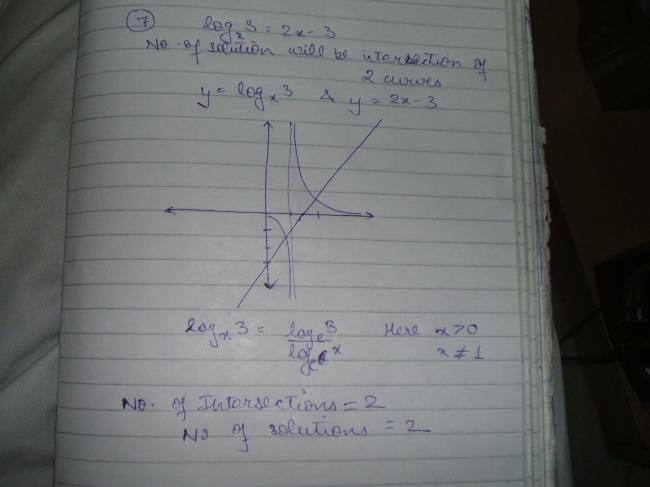
if u wanna try the rest then try them
or i will do the questions
ha ha ha ha ha ha ha ha
good work KALYAN
now there r some more
now some interesting 1's
draw the following curves as much as possible
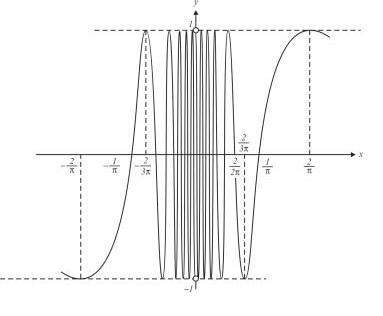
1)sin1/x
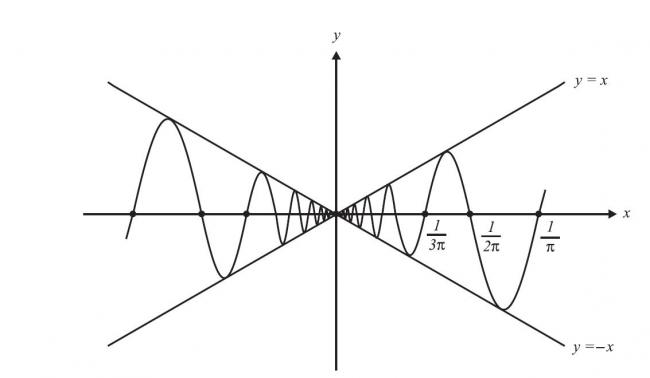
2)xsin1/x
3)x2sin1/x
4)x e1/x
5)x6-3x4+3x2-5
6)1/2sin2x +cosx
7)x+ln(x2-1)
yahan pe main kya pagalon ki tarah questions hi post karta jaoon
tell me if u wanna me to close this thread
if there would be no more replies then 4 me this thread will die[16]
Mani Do you want to post them in GOD;s?
I can give you a place there :)
sir jaise aap chahein
mera show to flop show nikla [17][2]
shayad aapke saath kuch hit ho jaye
subash now repair ur mistake by giving the answers to #6 and #9[1]
SOME MORE QUESTIONS
3)log(cosec x)
4)log(x2+1/2x) + sec-1x
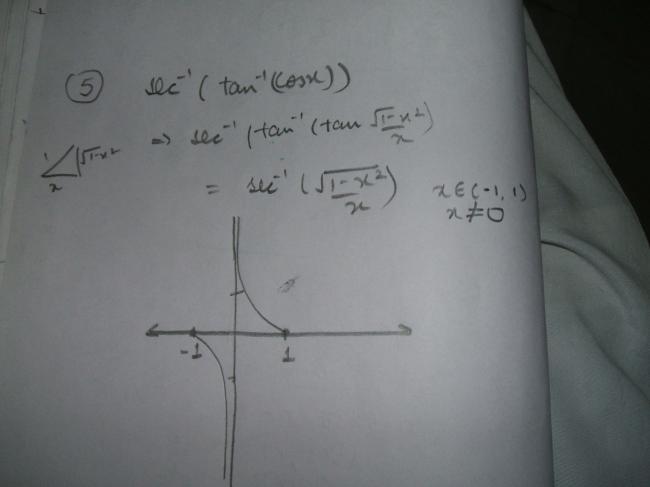
5)sec-1(tan-1cosx)
coming to the second graph
question becomes
2-x+sin2x
which can be done by addition of graphs i think
Wont the graph to the first one be...
because{-1+}=0 and {0-}=1
Sorry if there is a mistake
Remember {x} ranges between [0,1)
graph would hav still been wrong if it were -1
The graph as drawn by Subash (as in post #4) iis wrong. You should note that the function
f(x)=2^{\{x\}} is periodic. The graph will look like that drawn by kalyan in post #12.

