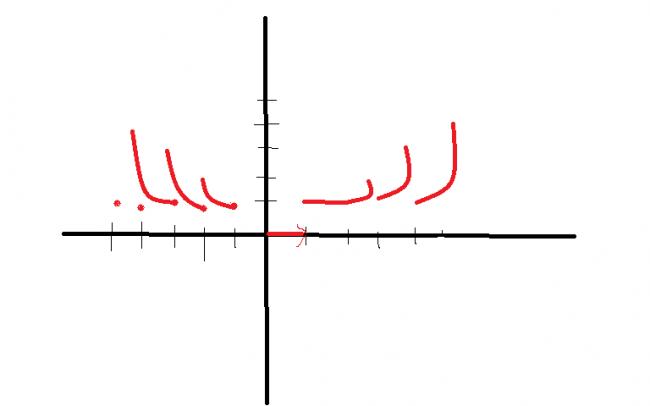
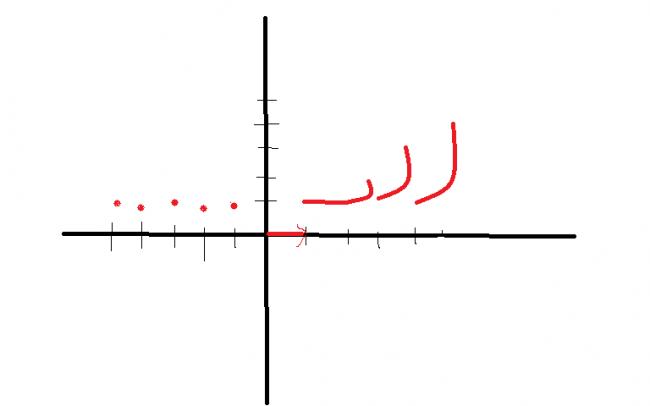
ur graph is interestin........wait m uploadin my answer!!!
due to lack of QOD's i had started googly from ATGS ... now that we are getting ample number of QOD's and no Graph of the day's
i start this trend now :P:P
Draw the graph of:
y=|[x]|{x}
the first graph is always easy :D
-
UP 0 DOWN 0 0 14

14 Answers
[x] =0 => y=0
[x] = ±1 => y=1
[x] = ±2 => y = 2x, x varying from [0,1)
[x] = ±3 => y = 3x, x varying from [0,1)
...
...
...
so on
look here
the graph
is
y=[x]{x}
okay now
x is always integer for the base
nd 0≤{x}<1
now
x<[x]{x}<x+1
for negative value of x
we will have integer points only [x]{x}=1 when x is an integer like -2.0,-3.0 etc
but if x is -2.6 etc then it wont exist as the value becomes imaginary
graph will be discont at evry integer point xpect 1
@MR FUNCTION: pls check for negative portion .. Why shouldnt negative portion be defined ? +ve portion is fine though
asish
suppose u take x=-2.9
that means
u are finding
y=-30.1
now
it is imaginary.......
i hope so
but if u take -2.0
it comes to one
so at evry integer point the value is 1
check it!!!
hope m correct
sorry
i made the graph of [x]{x}
din c the modulus sign
wait m drwaing
the graph

in the 2nd quad it will be a mirror image of 1st quad
no graph is a bit wrong according to me!!
check the graph for negative x axis :D
Well, instead of drawing the graph I am explaining it part by part(Hope nobody minds!) From 0 to 1:[x]=0 Hence it is a strt line [0,1) From 1 to 2 :[x] is 1. power anything is 1 so again a strt line. From 2to 3:[x] is 2: so draw the graph of 2 power x from 0 to 1 and replace it in 2 to 3 in the given graph. Proceed similarly for the positive side. For negetive side it is :1 from -1 to 0, 2 power x for -2 to -1{0<=x<1} and so on...
