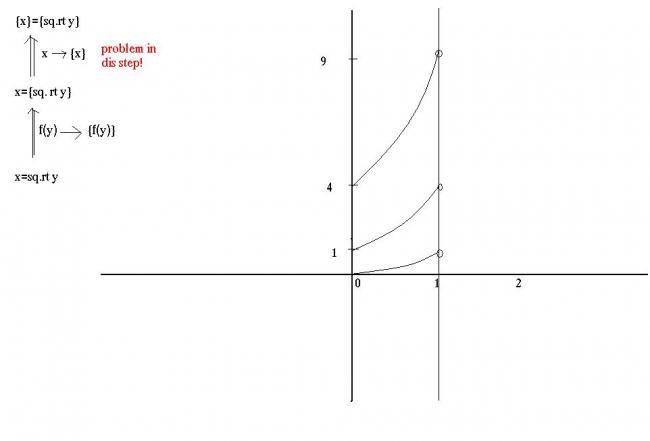
what is the flaw here???
( we were taught these transformations only!!!)
first if you have x=f(y)
then to transofrm to {x}=f(y)
you need to keep in mind that only those points can be transformed where f(y) lies between 0 and 1!!!
so you need to first plot x={√y}
Then make the transformations :)
i hve drawn this graph..
i hve also shown the transformations used... but i am getting a problem in the last step. how do u transform this??
x=f(y)→{x}=f(y)
if someone knows it, pls tell...
i didnt get u completely....
u mean all these steps??? if yes, then that means i should draw a y=1 line..??
but, then how do i shift the above parts of the already obtained graph????
Without any transformations etc../
we can simply write that this will hold if
x=√y + I (where I is an integer...)
so we need to simply draw the graph of
x=√y
x=√y+1
x=√y-1
and so on...
Wasnt this simple :D
You all got lost in the fractional parts on both sides ;)
Arshad was quite close.. but i dont know why he removed some points from the graph ;)
which points sir???
u mean the mirror images in the second quadrant???
what cuts???
oh shit i never realized that these cuts were there........!!
i will edit it.......
oh ok.. i thought you intentionally left out the integer points :D
onlly the 1st quadrant?
and are you sure the formations are correct?
i dint chek wid the oder quadrants...i think they r right...i ahev assumed values like .49,.81.25 to confirm.......hum x and y ulta kar diya..:)
further the graph is of y=x2 in (0,1). so the shape of the graph is wrong it should be a repetition of a curve which is concave upwards
THE GRAPH WILL NOT DEFINED AT ALL INTEGRAL POINTS>...though at places where y is a whole square it is defined..:)
and also there will be some more extra points where y is an integer...for example wen y=2,x=1.4,2.4 and .4 are also true