I can't see the graph!!
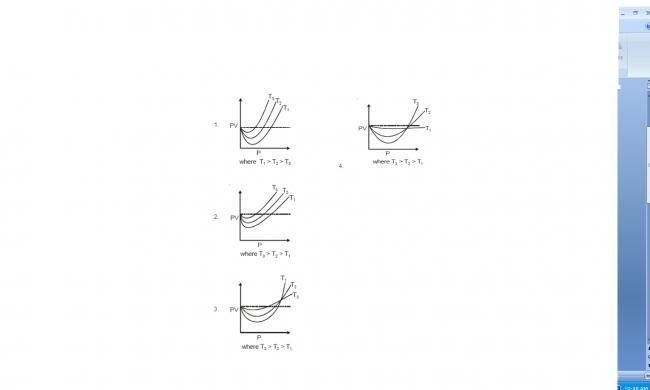
Out of the following, which graph between PV versus P correctly resembles for N2 at different temperatures?

-
UP 0 DOWN 0 0 5

Out of the following, which graph between PV versus P correctly resembles for N2 at different temperatures?
